
ISOcore ISO management platform: ISO 9001, 14001 and 45001 documentation, non-conformance management, corrective actions and audit scheduling.


ESGnet is an ESG reporting platform built by our team at Arke Technologies (Pty) Ltd in Johannesburg. It collects environmental, social and governance performance data and reports it in line with the GRI and SASB frameworks, and it is designed for ESG officers and for investor-facing sustainability reporting.
| Item | Detail |
|---|---|
| What it is | An ESG performance data collection and reporting platform |
| Frameworks | Aligned to GRI and SASB |
| Built for | ESG officers, and investor-facing sustainability reporting |
| Technology | React, PostgreSQL and a data visualisation layer |
| Built by | Our own software team |
This case study is part of our work. We describe systems in general terms by default, and in more detail only where the organisation using them has agreed.
ESG figures come from all over an organisation: fuel and electricity records, water meters, waste manifests, payroll and HR systems for headcount and training, safety registers and procurement records. In many organisations they live in spreadsheets kept by different people at different sites. When the sustainability report falls due, the ESG officer spends the time reconciling versions instead of reading the performance, and an investor's question about one figure can take days to trace.
The frameworks add a second layer. The GRI Standards are written for reporting an organisation's impacts on the economy, the environment and people, to a broad audience. The SASB Standards, now maintained by the International Sustainability Standards Board (ISSB), set out industry by industry the sustainability topics most likely to affect financial performance, which is what investors ask about. An organisation that reports to both audiences needs the same underlying figure expressed in two frameworks' terms, and a folder of spreadsheets does not keep those in step.
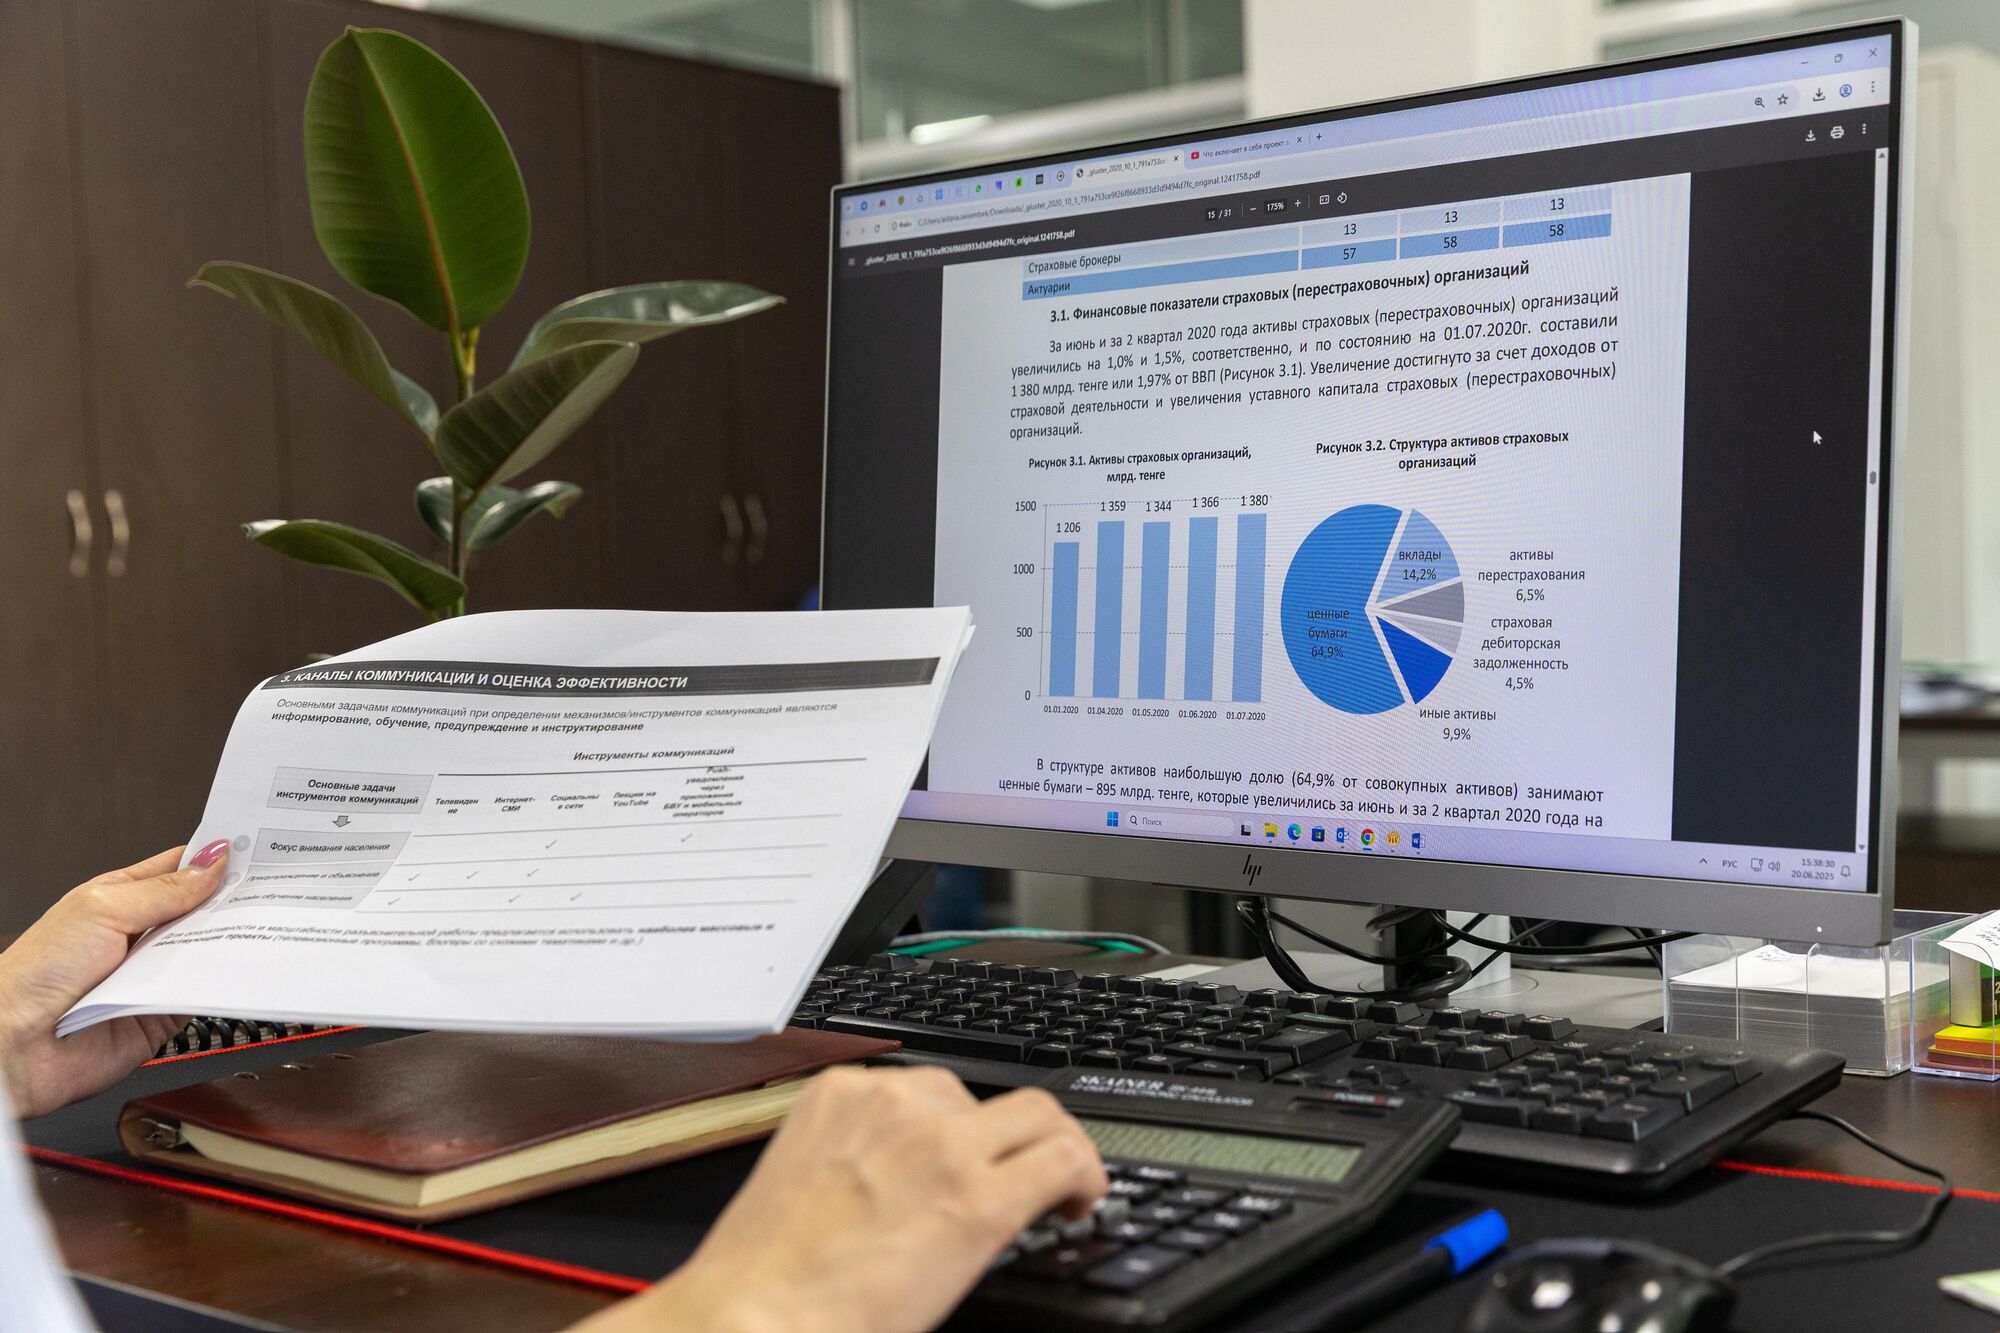


ESGnet runs on PostgreSQL, a relational database, because ESG data is structured by nature: each figure belongs to an indicator, a reporting period, a part of the organisation and a unit of measure. A relational model keeps those links consistent and lets one query answer "what did this site report, for which period, against which indicator".
React drives the screens for capturing data and reading dashboards, and the visualisation layer turns figures into charts. We bring the same discipline to data, analytics and business intelligence work: a report is only as good as the pipeline behind it.

There are four common routes. The right one depends on where your data lives today and how many frameworks you report against.
| Route | Suits | Watch for |
|---|---|---|
| Spreadsheets | A first report, a few sites | Version control, no audit trail, dependence on one person |
| Off-the-shelf ESG software | Standard indicators and a fast start | Fit to your sites and data sources; data export terms at exit |
| A platform built for you, like ESGnet | Several frameworks, unusual data sources, links to existing systems | Needs a clear scope, an owner and support after launch |
| Dashboards over existing systems (Power BI) | Data already complete and clean at source | Reports on data, but does not collect it or record approvals |
01.
We map your indicators, frameworks, sites, data owners and reporting calendar before proposing anything.
02.
We design the indicators, periods, entities and approval steps first, because they decide everything that follows.
03.
We build in increments, and each release is designed not to break what already works.
04.
We connect the systems that already hold your figures, from HR and finance to metering exports, through systems integration and data migration.
05.
We document the platform and hand it to your team, or support it under a service-level agreement: incidents ranked P1 to P4, changes under change control, and a monthly service review and report.
Platform work is quoted per project after scoping, and the proposal fixes scope, milestones and price before work starts. You can buy through a proposal and purchase order, or a tender response in which we complete the standard bidding documents (SBD forms). Arke Technologies is a Level 1 B-BBEE contributor, giving 135% procurement recognition (sworn affidavit available on request); our company documents, CSD supplier number and SARS tax compliance status are available on request.

ISOcore ISO management platform: ISO 9001, 14001 and 45001 documentation, non-conformance management, corrective actions and audit scheduling.

Server Hub commerce and quoting platform: our own B2B catalogue and evidence-backed quoting system.
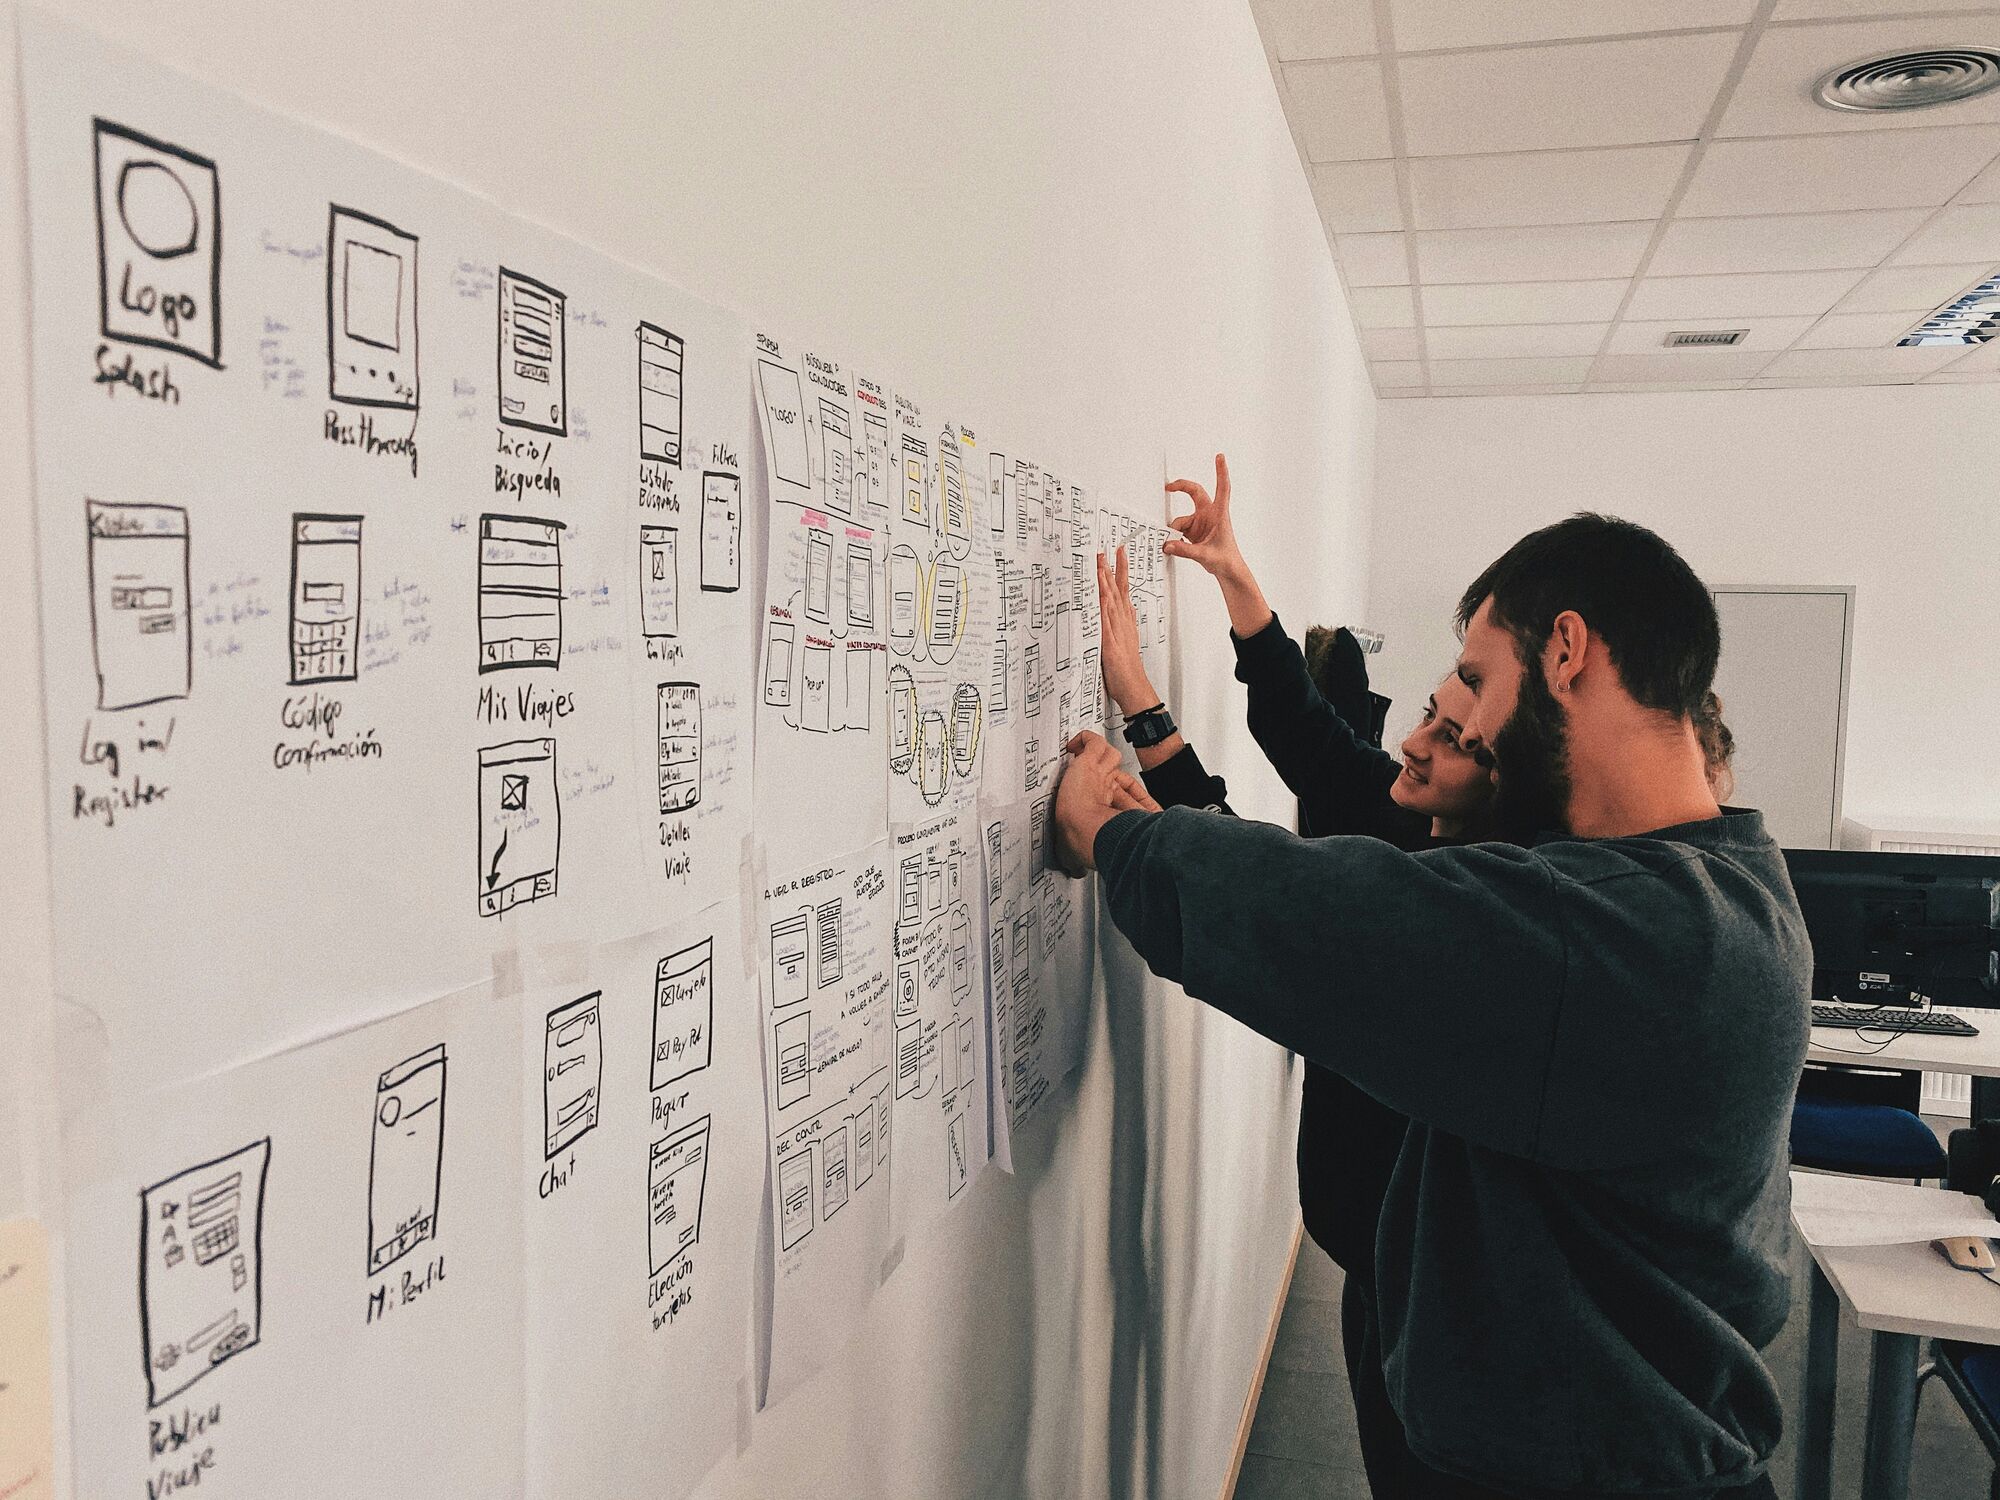
Custom software development and SaaS product development: how we build platforms like these for clients.
An ESG reporting platform is software that collects environmental, social and governance performance data from across an organisation and turns it into reports aligned to recognised frameworks such as GRI and SASB. It replaces scattered spreadsheets with one structured record, so figures can be traced to their source, compared year on year and reused across reports for boards and investors.
GRI reports an organisation's impact on the world, while SASB reports how sustainability affects the organisation's finances. The GRI Standards cover impacts on the economy, the environment and people, for a broad audience of stakeholders. The SASB Standards, now maintained by the ISSB, set out industry by industry the topics most likely to affect financial performance, for investors. ESGnet reports in line with both.
Yes. We build ESG and sustainability reporting platforms, the dashboards on top of them and the data pipelines behind them, and ESGnet is our own example. We start with your indicators, frameworks, sites and data sources, design the data model before writing code, and connect the systems that already hold your figures, such as HR, finance and metering records.
There is no standard price: a custom ESG reporting platform is priced on its scope, and published South African rates for IT project work run from about R550 to R750 an hour ex VAT (matnet.co.za, September 2026). The scope is set by the indicators, frameworks, sites and data sources, the integrations, the approval steps, and hosting and support. We quote per project after scoping.
Use dashboards when your ESG data is already complete and clean in your source systems, and build a collection platform when it is not. Power BI is designed to report on data, not to collect it from site managers or record who approved each figure. Many organisations need both: a collection layer for the data, and dashboards on top for the board.
Tell us which frameworks you report against and where your figures live today, and we will scope a platform, a dashboard layer or both. Send us your brief, email info@arketechnologies.com or call 010 447 2445; we aim to respond to new enquiries within one business day.