
BI strategy, consulting and analytics
Advice that starts from the decisions your board, council or governing body must make and maps them to measures, source systems and a costed, phased roadmap.

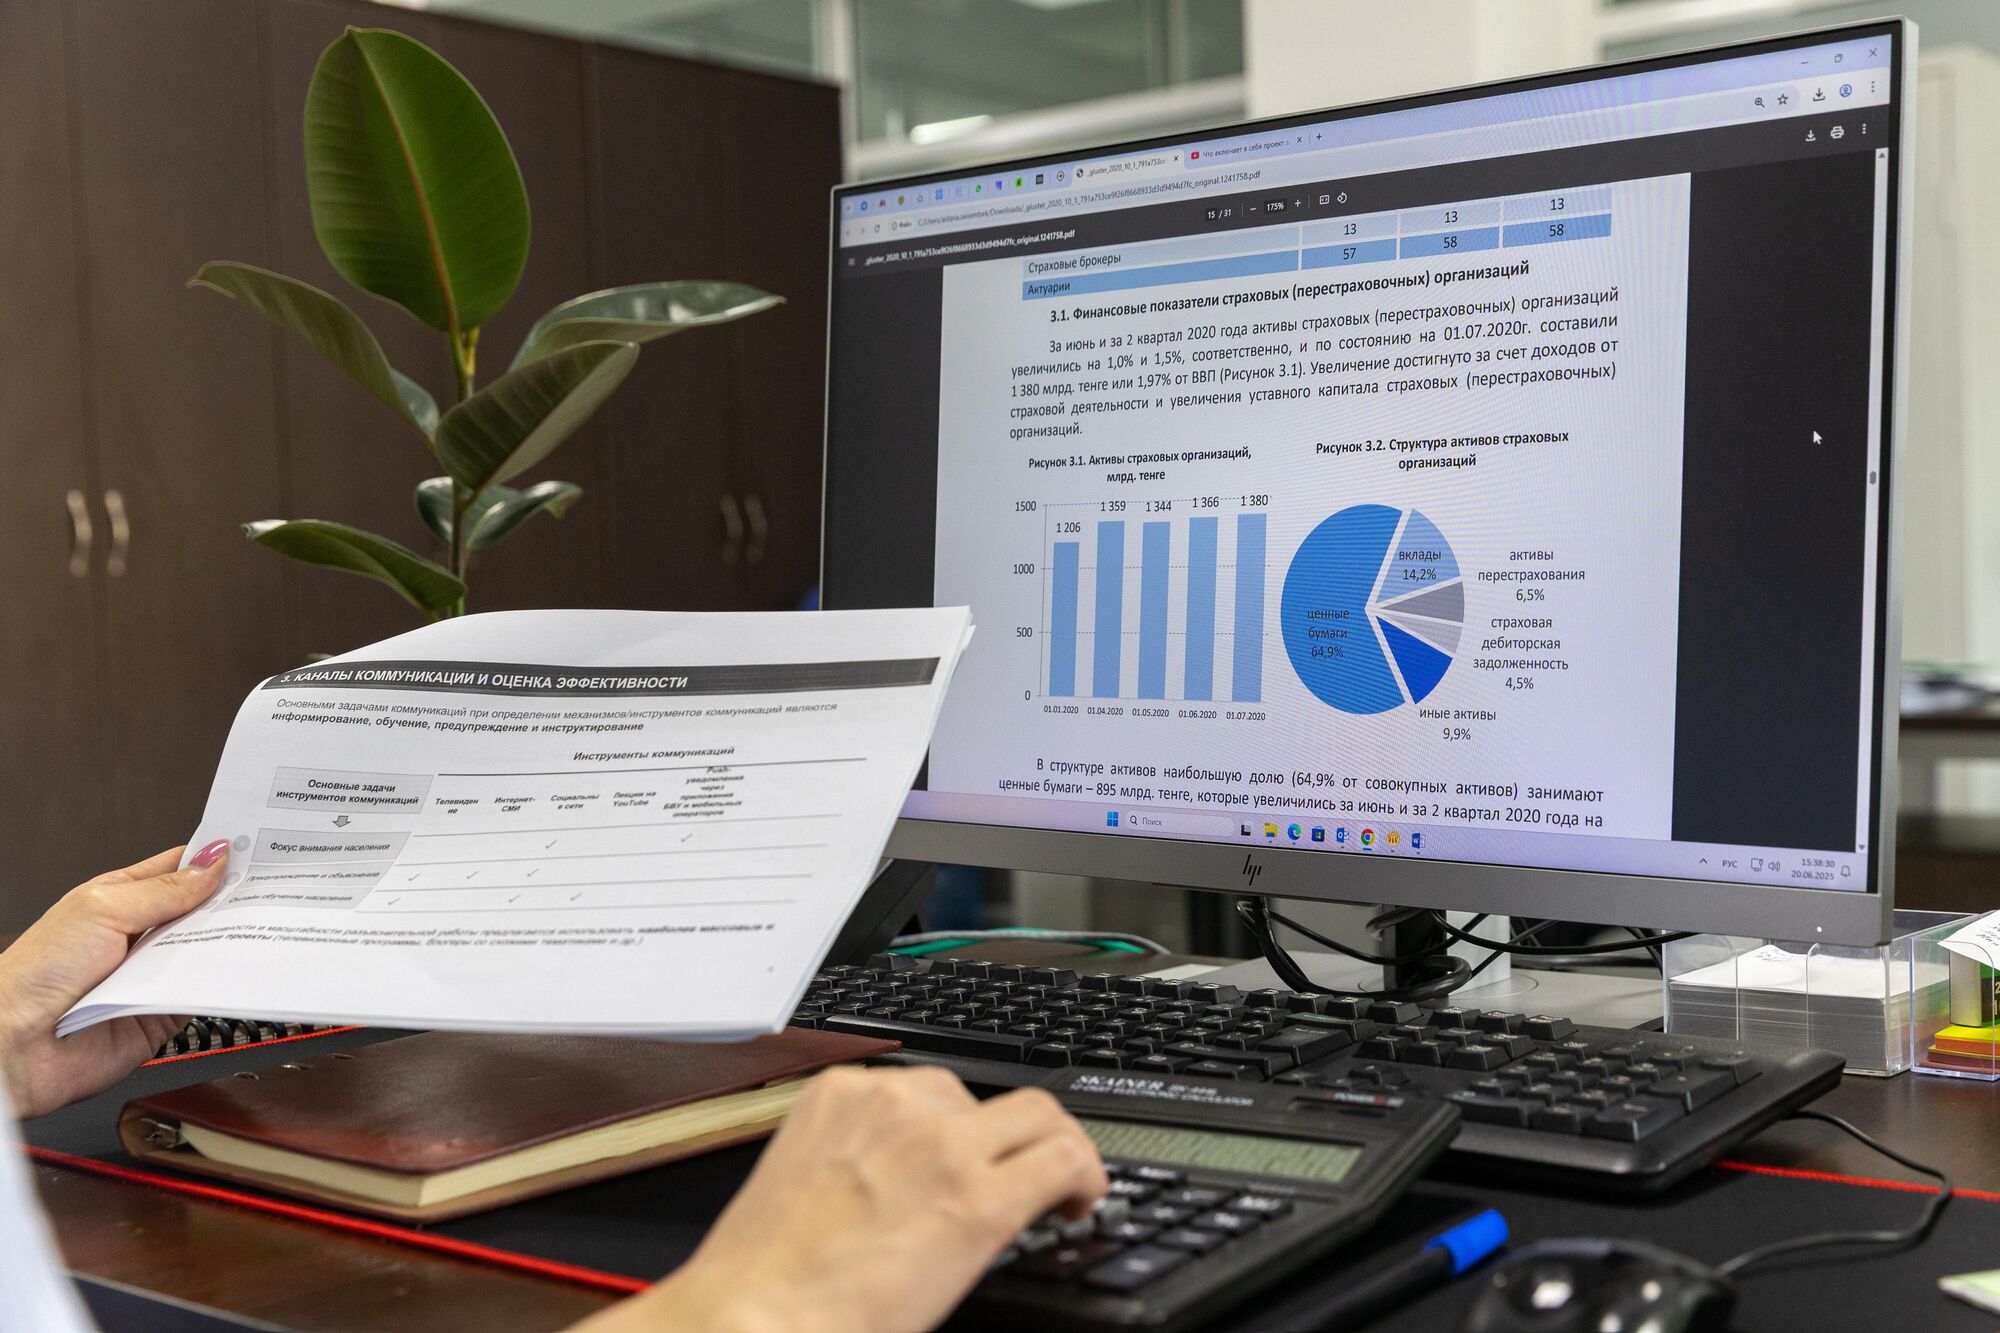
Arke Technologies (Pty) Ltd provides business intelligence advisors and data engineers from Johannesburg. We help South African organisations, government bodies and schools turn scattered records into a governed data warehouse and reports that auditors can trace, on Microsoft Fabric, Power BI or Google BigQuery, built and supported under one SLA.
Data analytics is the work of collecting, cleaning and examining data to answer a question or support a decision. In plain terms, data analytics means using the records you already hold, such as invoices, meter readings, learner marks and stock movements, to see what happened, why, and what is likely to happen next.
Business intelligence (BI) is the part of data and analytics that most organisations need first: a data warehouse, agreed definitions, and the reports and dashboards managers read every week. Done well, business intelligence is a discipline rather than a tool: every figure in a board pack traces to its source record, and finance, operations and audit all accept it.
Data analysis for business intelligence therefore starts with plumbing rather than charts: connecting systems, reconciling records that disagree and agreeing the meaning of each measure. That is why this work sits beside our systems integration and custom software development practices. For a primer, read what is business intelligence, and what does Power BI do.


Buyers often ask about the difference between data science and analytics, or between business intelligence and business analytics. They sit on one spectrum, from describing the past to predicting and automating the future, and differ in method more than in purpose.
| Discipline | Question it answers | Typical methods | Typical output |
|---|---|---|---|
| Business intelligence and reporting | What happened, where and why? | Data warehouse, agreed measures, drill-down | Management packs, dashboards, business intelligence reports, exception lists |
| Business analytics | What is driving the result? | Trend, variance and cohort analysis; statistics | Driver analysis, scenarios, budget against actual |
| Predictive data analytics | What is likely to happen next? | Forecasting, regression and classification models | Demand and cash-flow forecasts, risk scores |
| Data science and AI | What should we do, and can it be automated? | Machine learning, Python and SQL, AI models | Recommendations and automated steps, with a person approving |
| Big data analytics | What do very large or fast-moving data sets show? | Distributed processing on cloud platforms such as Google BigQuery | Analysis of logs, sensor readings or transactions at volume |
Most organisations gain more from reliable business intelligence first, and add prediction once the data is trusted.

We advise, build and run. Each service below is available on its own or as one programme under one contract, alongside our other IT services.
Advice that starts from the decisions your board, council or governing body must make and maps them to measures, source systems and a costed, phased roadmap.
Pipelines that extract data from accounting, ERP, CRM, billing and HR systems, clean and match it, and load it with its history into a warehouse.
BI reporting that replaces the month-end spreadsheet scramble: management accounts, KPI scorecards and exception reports, refreshed on a schedule.

Design, build, licensing advice, training and support. See Power BI consulting and dashboards.

One secure place, such as a Power BI app or an intranet page, where each person finds the reports they may see, under your own name and logo. See SharePoint and intranets.

Forecasts, anomaly detection and plain-language questions over trusted data, built with our AI consulting and implementation team on one rule: AI recommends, people decide, and every AI action is logged.
Data profiling, a data dictionary, a business owner for each measure, access rules and a change process, so the numbers stay right after go-live.
Refresh monitoring, fixes, new measures and user support, with incidents prioritised P1 to P4 and reported at a monthly service review.
What is a data warehouse? It is a database designed for reporting rather than transactions. Data from every source system is loaded, cleaned, matched and kept with its history, so reports never slow the finance system and last year's figures survive a change of software. A data lake stores raw files of any shape cheaply, for later processing; a lakehouse combines the two on one storage layer.
| Data warehouse | Data lake | Lakehouse | |
|---|---|---|---|
| Holds | Structured, cleaned, modelled data | Raw files: tables, logs, documents, images | Raw and modelled data on one storage layer |
| Best for | Trusted reporting and BI | Data science, archives, large or unstructured data | Organisations that need both without keeping two copies |
| Governance | Strong: defined tables and measures | Weak unless actively managed | Strong where the modelled layer is governed |
| Examples | Google BigQuery, a Microsoft Fabric warehouse, Azure SQL, PostgreSQL, the Snowflake data warehouse | Cloud object storage, OneLake | A Microsoft Fabric lakehouse |
The data lake vs data warehouse decision is rarely either-or. Most mid-sized organisations need a warehouse first, and add lake storage only once they hold large volumes of logs, documents or sensor data.
We build on Microsoft Fabric (Microsoft's data platform, which now includes Power BI), Google BigQuery (Google Cloud's serverless warehouse) and PostgreSQL, across Microsoft Azure and Google Cloud. Some large estates already run SAP Business Warehouse, SAP BusinessObjects or a Snowflake data warehouse. We assess any existing platform in discovery, and the proposal states in writing whether we would build on it or read from it into a governed model. Loading any warehouse is as much a data migration task as a reporting one.
BI tools, BI software and data analytics software all do the same five jobs: connect to sources, prepare the data, store it, model it and present it. The right business intelligence system is the one that fits your licences, data and skills, not the one at the top of a ranking.
| Suite | Main components | Usually fits |
|---|---|---|
| Microsoft business intelligence suite | Power BI, Microsoft Fabric, Excel, SQL Server Reporting Services | Organisations on Microsoft 365, and finance teams that live in Excel |
| Google data analytics | Google BigQuery, Looker Studio, Looker, Google Sheets | Organisations on Google Cloud or Google Workspace |
| SAP business intelligence | SAP BusinessObjects, SAP Analytics Cloud, SAP Business Warehouse | Large organisations whose core systems run on SAP |
| Specialist BI software tools | Tableau, Qlik and similar | Analyst teams focused on visual exploration |
| Built-in reporting | Reports inside ERP, CRM and accounting software | Operational reports from a single system |
Microsoft BI is the natural fit where Microsoft 365 is already in place, because Power BI shares its sign-in, Teams and SharePoint. Data analytics in Excel is where most analysis starts, and it serves exploration well. The risk comes when a material figure depends on one person's workbook with no audit trail, so we move recurring, material reports onto a governed model.
Data analytics methods range from simple aggregation to machine learning; data analytics methodologies, of which CRISP-DM is the best known, describe the steps around them. Ours follows the same arc inside a governed engagement, so nothing is built before scope and cost are agreed.
01.
Which decisions the reports must support, who makes them, how often and at what level of detail.
02.
A source audit: every system, the quality of its data, who owns it and how we will read it with the least access needed.
03.
A phased plan with licences, platform running costs and build costs shown in writing before you commit.
04.
Scope, P1 to P4 priority levels with response and resolution targets agreed to your needs, exclusions, reporting and term.
05.
The warehouse and pipelines first; then the model, with each measure defined once and signed off by its business owner; then reports refined with the people who use them.
06.
Documentation of sources, pipelines, measures and refresh schedules, and training for report users and your own analysts.
07.
Refresh reliability, data-quality exceptions, report usage, changes made and decisions needed.
BI by industry differs less in technology than in the questions and rules that apply:

Collections reporting that reconciles billing, metering and valuation records and lists the exceptions. See municipal revenue enhancement.

Performance against the annual performance plan, with the audit trail PFMA reporting expects. See IT for the public sector.

Enrolment, attendance and results dashboards from SA-SAMS exports and learning platforms, with learner data protected under POPIA. See IT for schools and education.

Management accounts, debtor days and profitability by client, from Sage, Xero, SAP Business One or Dynamics 365 Business Central. See ERP and accounting integration.
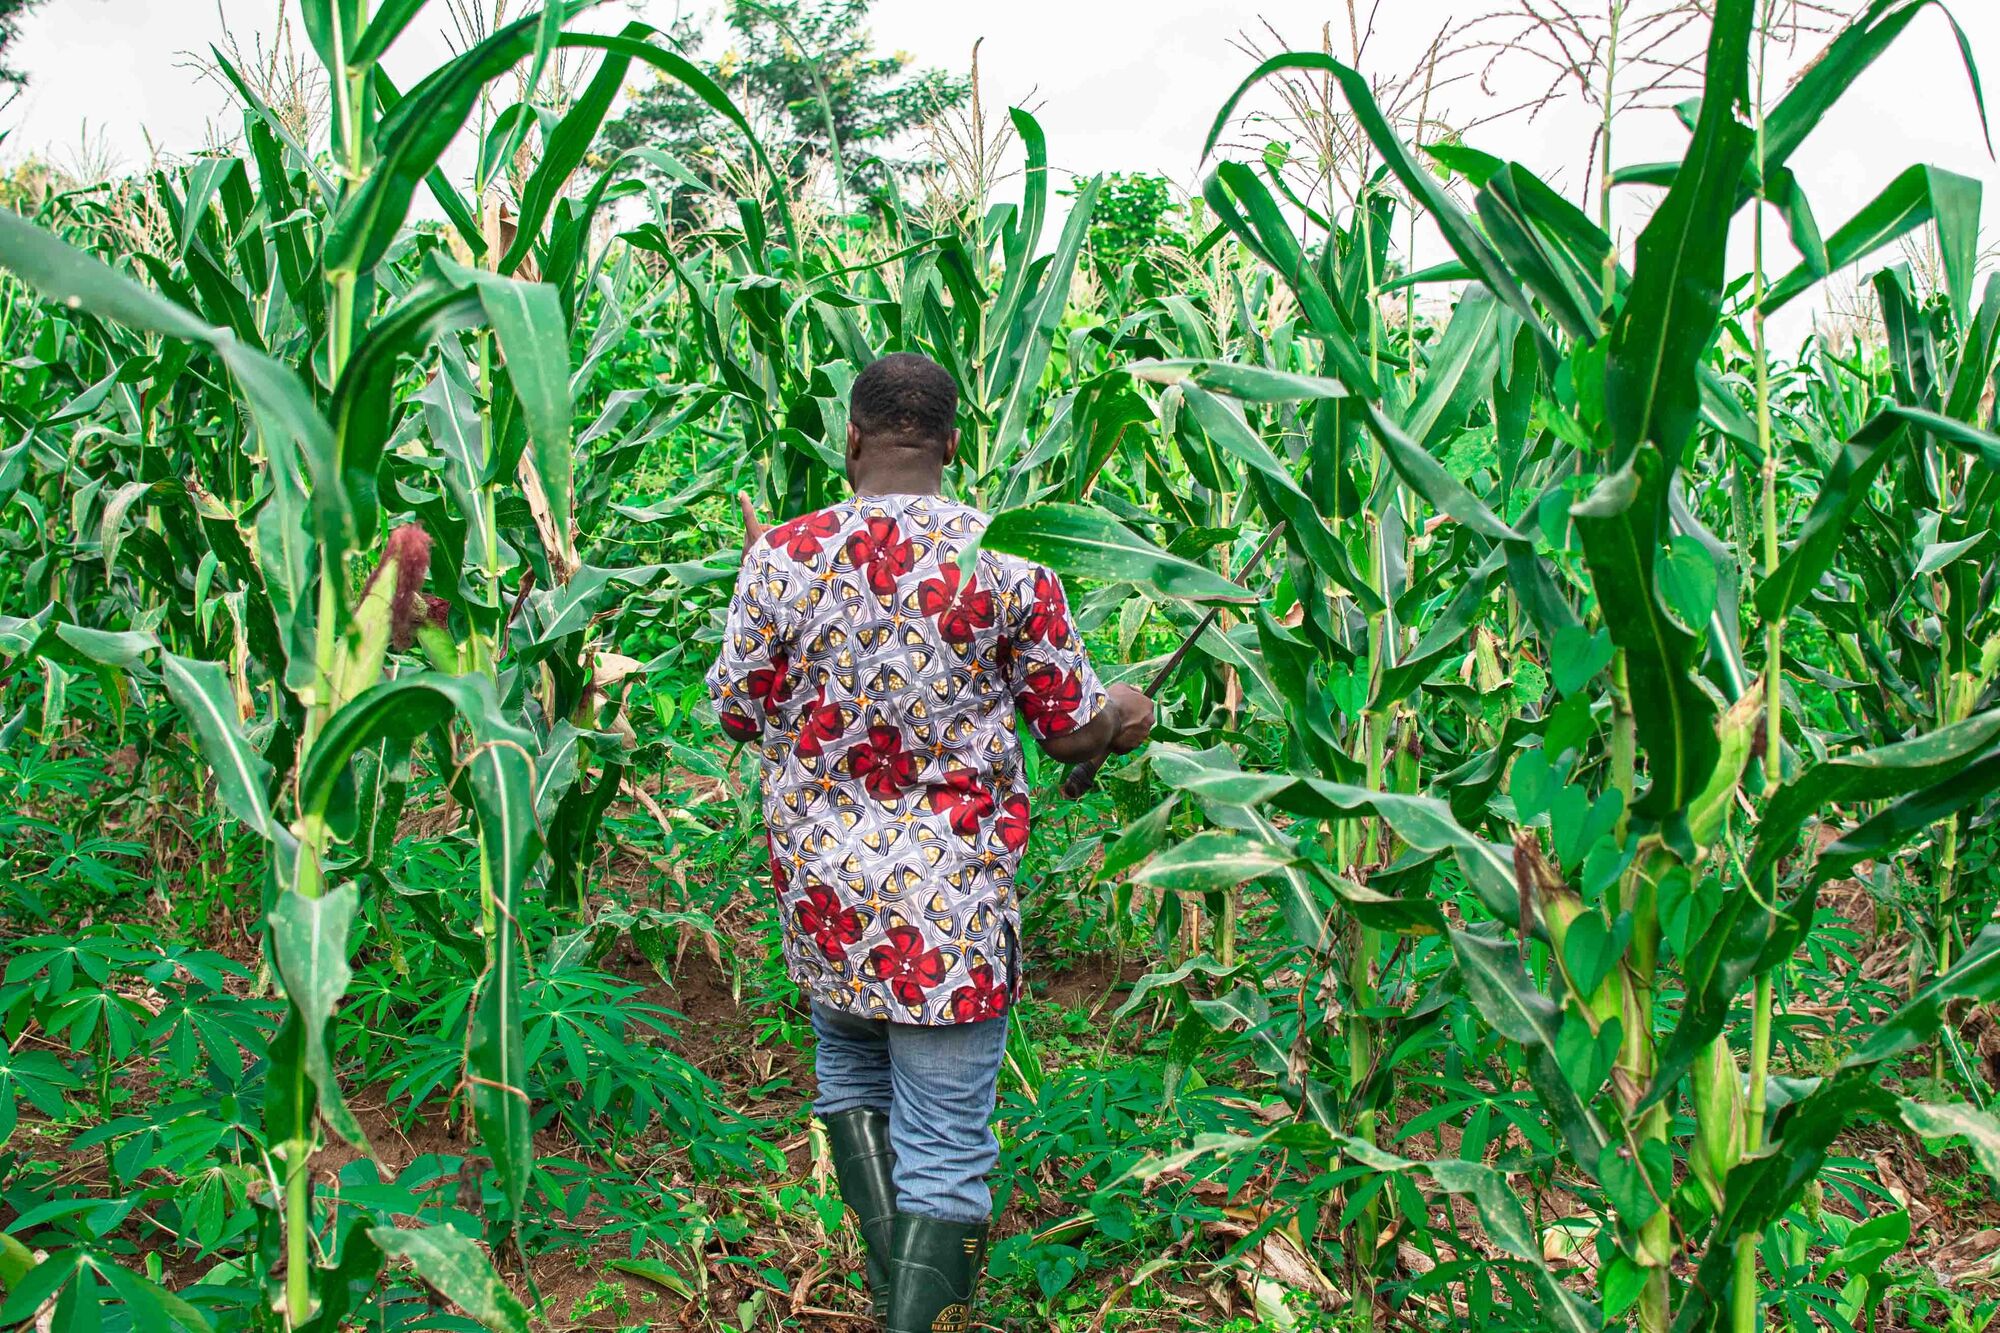
Sales, stock and route reporting across branches. See IT for agriculture, logistics and distribution.
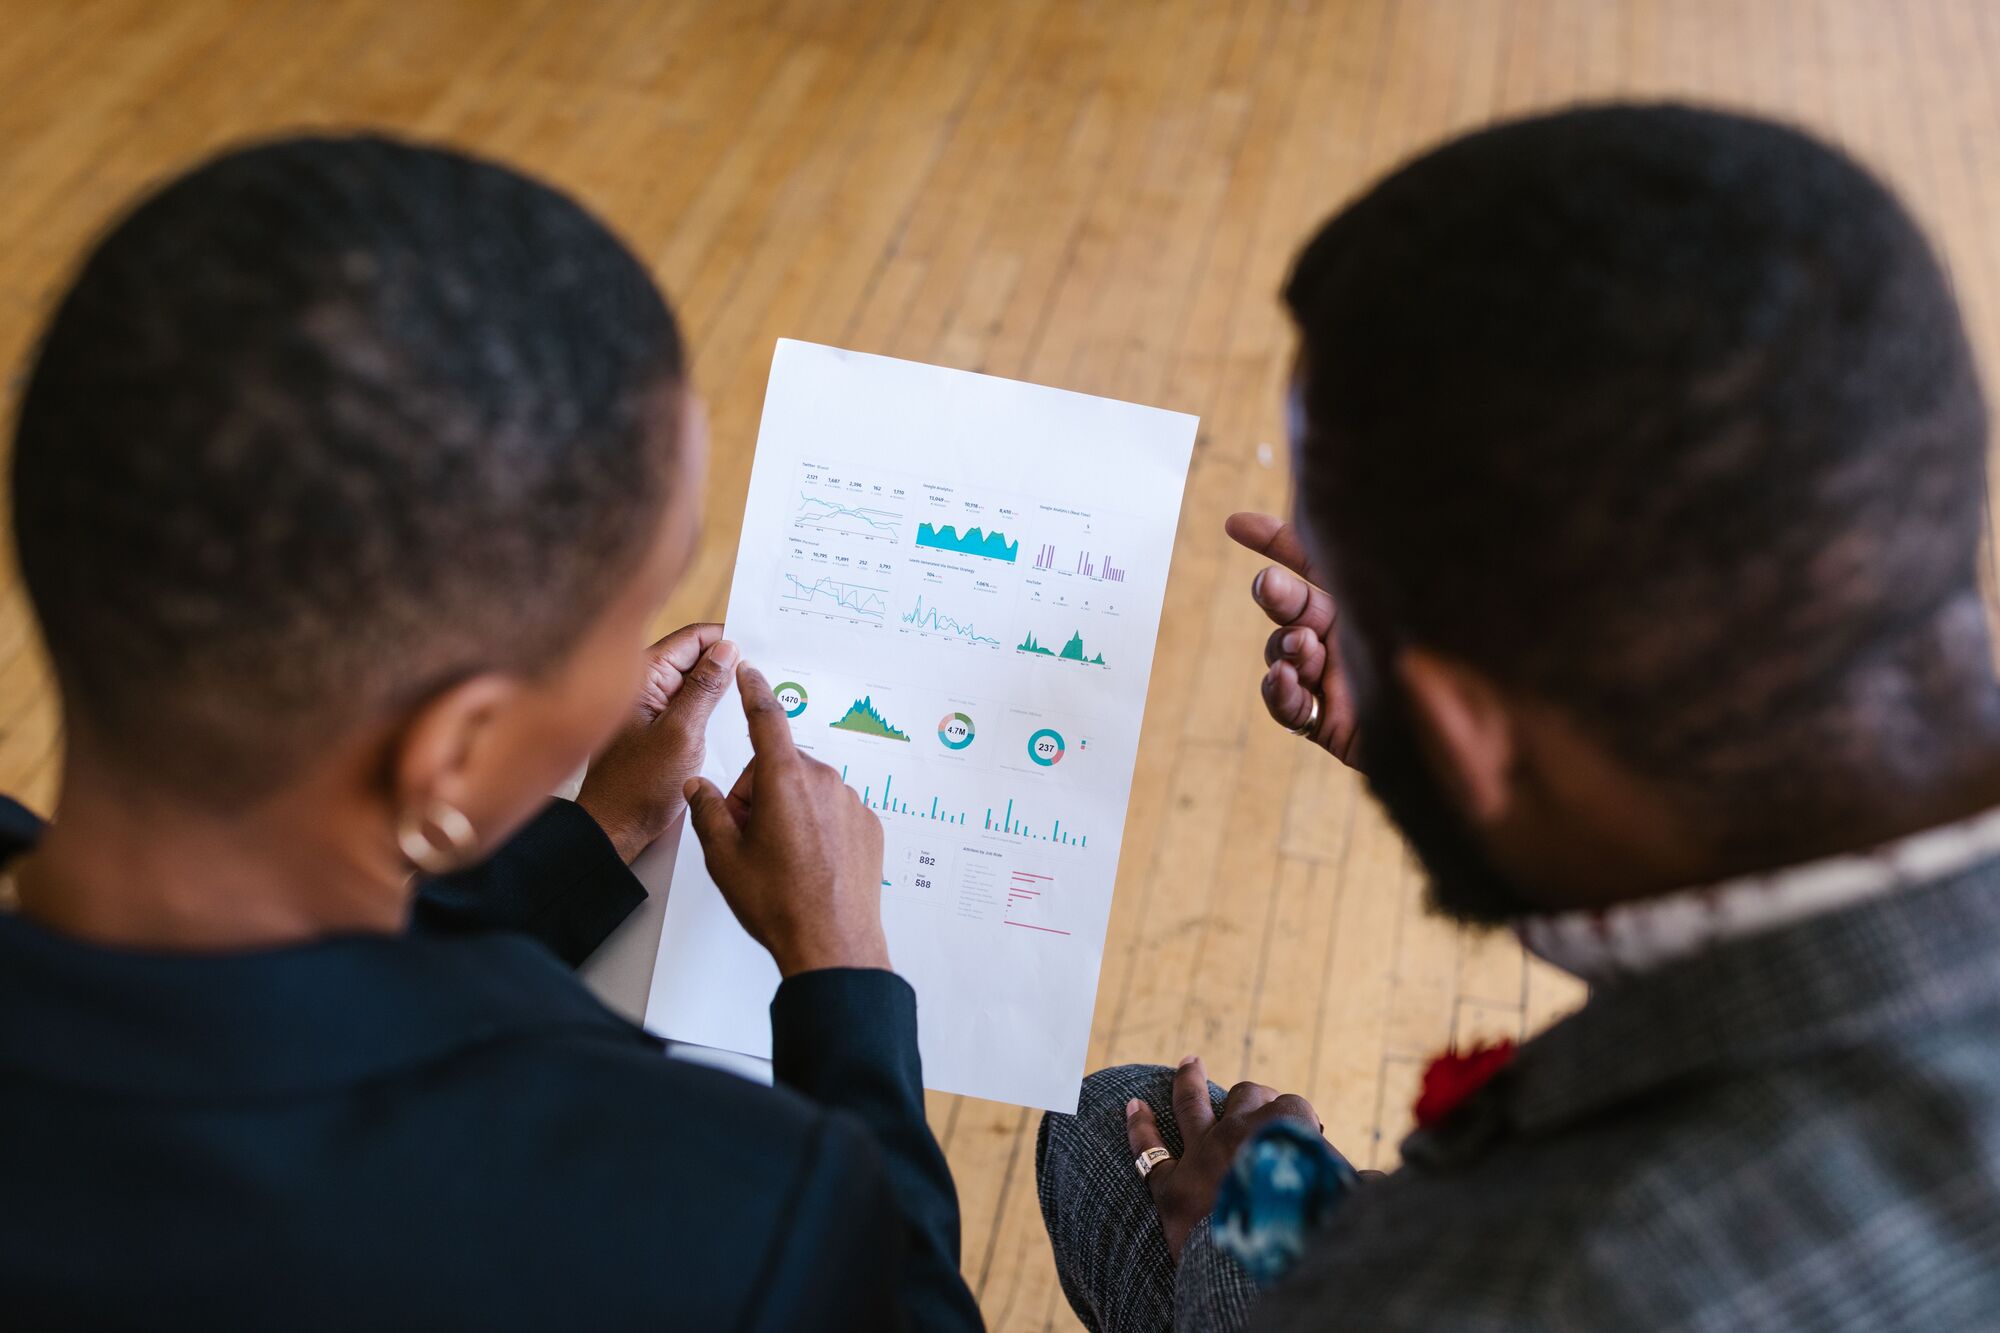
Our team built ESGnet, which collects environmental, social and governance performance data and reports it in line with GRI and SASB.
International business intelligence for organisations operating in South Africa, consolidating entities that report in more than one currency, supported from Johannesburg.
Reports help a board only if the board can rely on them. Every engagement includes:
Arke Technologies (Pty) Ltd has been a registered company since 2017, trading first as Fibre Boyz, and is a Level 1 B-BBEE contributor, which gives buyers 135% procurement recognition (sworn affidavit available on request). Company documents, our CSD supplier number, SARS tax compliance status and a bank confirmation letter are available on request, and we complete standard bidding documents (SBD forms) when a bid requires them. You can buy through a proposal and SLA, a purchase order or a tender response. See company facts and procuring from Arke.
Continuity is designed in. A certified team delivers remote-first under one contract, so adding a data source or a subsidiary changes the SLA schedule, not the supplier. The warehouse, models and reports are built in your own tenant or cloud account, so you own them, with the data, credentials and documentation; if the work moves, we hand everything over in an orderly exit. Everyone with access to your data is bound by confidentiality and our security controls.

Last reviewed: September 2026.
A business intelligence solution has three cost lines: licences, the build and the upkeep. Licences are the most visible, but the build, and above all the data work inside it, is usually the largest.
For market context, published hourly rates for IT project work in South Africa run from about R550 to R750 ex VAT (matnet.co.za, September 2026). We quote BI work per project, in phases, after a scoping session, and ongoing support under an SLA, with licence and platform running costs shown separately.

Most organisations want their own people to own the numbers, so we plan the in-house roles alongside the build. An in-house team needs data analytics skills in SQL, data modelling, a BI tool such as Power BI and basic statistics, plus knowledge of the business; a short Python program helps with automation.
The roles differ: a BI developer (business intelligence developer) builds pipelines, models and reports; a business intelligence analyst turns managers' questions into measures; a data scientist builds predictive models. Routes into these roles include:
A certification in data analytics shows study; experience on your own data makes it count. We work beside in-house analysts in a co-managed IT arrangement, document what we build and train your team at handover, so the capability stays with you.

Business intelligence advisors help an organisation decide which figures it needs, where they come from and how to report them reliably. The work covers mapping decisions to measures, auditing source systems, designing the data warehouse and choosing BI tools. Good advisors also build and support what they recommend, or hand it to a team that can, so the advice turns into reports people use.
Data analytics answers defined business questions from prepared data, while data science builds models that predict, classify or automate. An analyst might explain why collections fell last quarter; a data scientist might build a model that flags accounts likely to stop paying. Both need clean, well-governed data, which is why most organisations invest in business intelligence and reporting first.
A data warehouse is a database built for reporting, holding cleaned and matched data from all your source systems with its history. You need one when reports draw on several systems, when those systems disagree about the same customer or property, or when auditors ask how a figure was produced. With a handful of clean sources, Power BI's own storage can be enough to start.
AI is used in data analytics to forecast demand or cash flow, flag unusual transactions, classify documents and answer plain-language questions about trusted data. Artificial intelligence and data analytics work best together when the underlying data is governed, because AI repeats the errors in its sources. We build it on one rule: AI recommends, people decide, and every AI action is logged and reviewable.
A business intelligence analyst turns managers' questions into measures, reports and dashboards, and explains what the figures show. The work includes gathering requirements, checking data quality, writing queries in SQL or DAX, designing reports and presenting findings. The best analysts understand the business as well as the tools, so they can tell when a number is technically correct but misleading.
A business intelligence solution costs licences plus the build and upkeep, and the data work in the build is usually the largest part. Power BI Desktop is free, and sharing needs per-user or capacity licences. Published hourly rates for IT project work in South Africa run from about R550 to R750 ex VAT (matnet.co.za, September 2026). We quote per phase after a scoping session.
Yes, we can scope and deliver business intelligence for municipalities, national and provincial departments and public entities, with the documented audit trail that MFMA and PFMA reporting expects. For a municipality, that usually starts with reconciling billing, metering and valuation records. We are a Level 1 B-BBEE contributor, complete SBD forms when a bid requires them, and provide our CSD number and tax compliance status on request.
Tell us which reports you produce today, where the data lives and which decisions they must support. We will scope a phased build, with licences and running costs shown before you commit. Talk to us.